Samuel Le Cam1 , Magdalena Valenta1, and Robert Schneider1§
1IFE, Helmholtz München, Neuherberg, BY, DE
§Correspondence to: Robert Schneider (robert.schneider@helmholtz-munich.de)
Abstract
Description
Methods
Extended Data
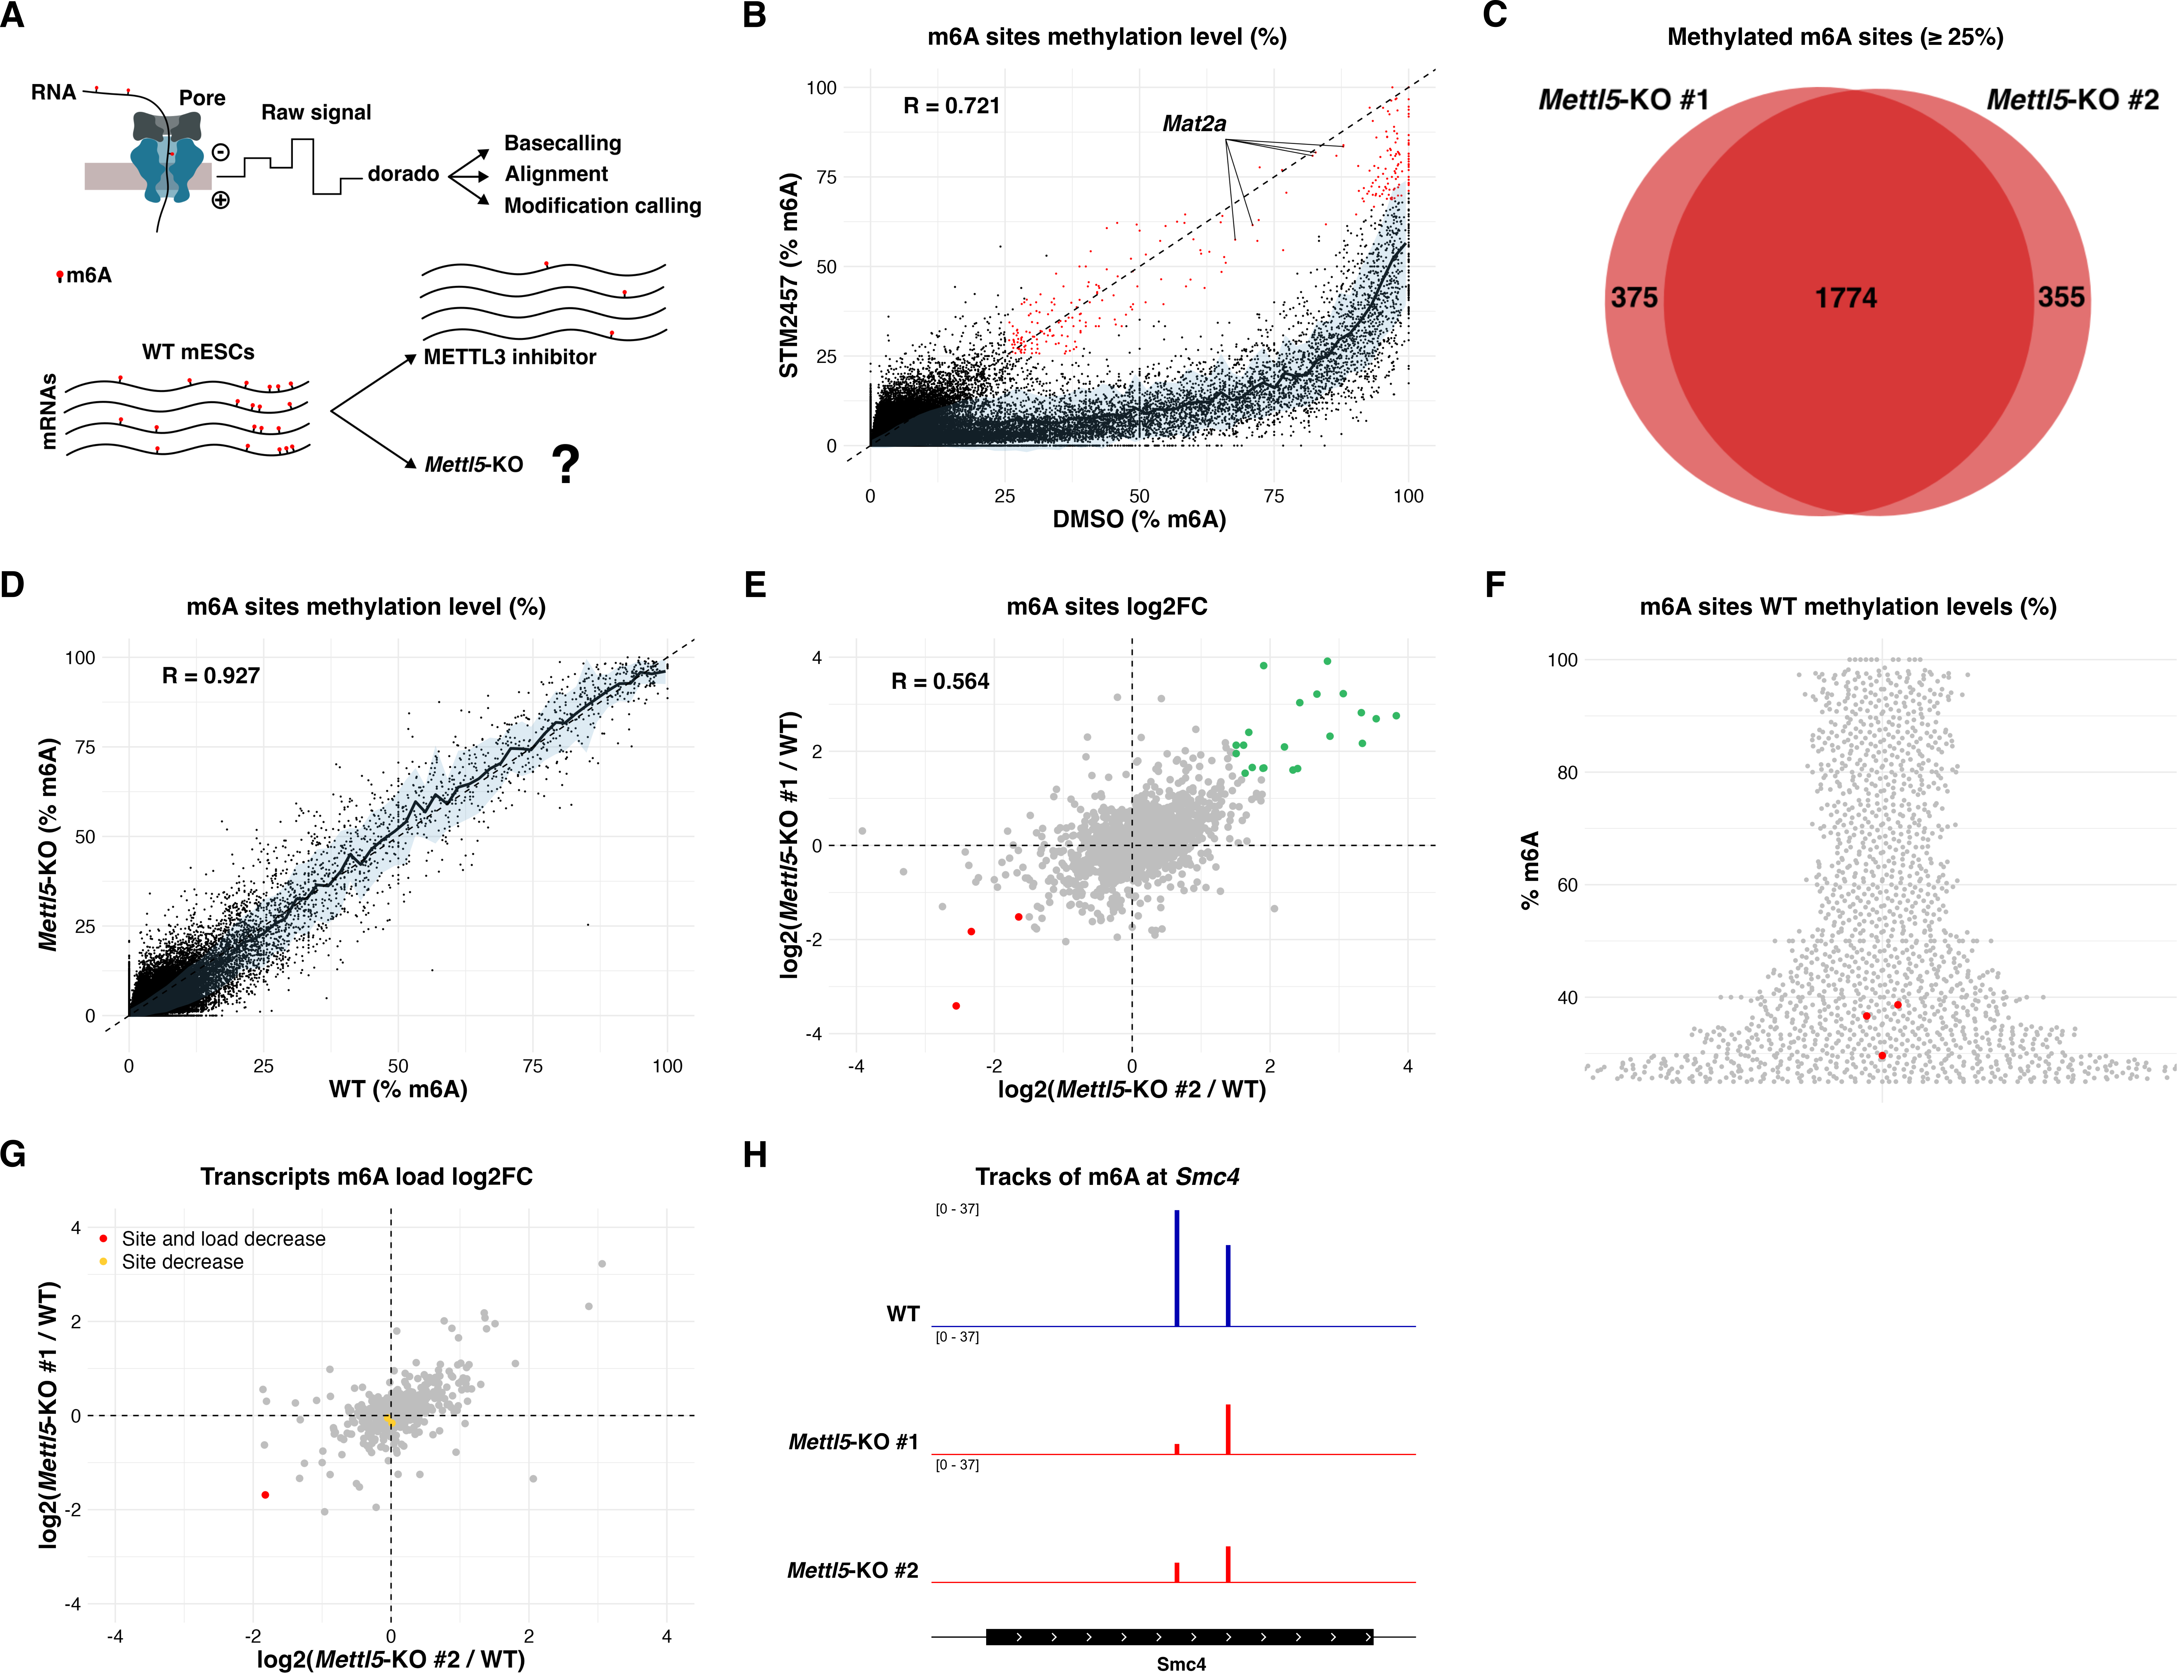
- Description: Density distribution of m6A sites in WT mESCs as a function of methylation level as an alternative view of Figure 1F without cut-off. Red lines indicate m6A sites with reduced methylation levels in both Mettl5-KO clones. 25% methylation level is indicated by a dotted line.. Resource Type: Image. DOI: 10.22002/ww9vz-47694
Conflicts of Interest
Funding
Author Contributions
- Samuel Le Cam: Resources, Investigation, Data curation, Visualization, Writing - original draft
- Magdalena Valenta: Resources, Writing - review & editing
- Robert Schneider: Conceptualization, Funding acquisition, Supervision, Writing - review & editing
Reviewed By
Anonymous
History
- Received: 4/27/2026
- Revision Received: 5/4/2026
- Accepted: 5/6/2026
- Published Online: 5/8/2026
- Indexed: 5/22/2026
Copyright
© 2026 by the authors. This is an open-access article distributed under the terms of the Creative Commons Attribution 4.0 International (CC BY 4.0) License, which permits unrestricted use, distribution, and reproduction in any medium, provided the original author and source are credited.
Citation
PubMed Central: 13197891
PubMed: 42181001
microPublication Biology is published by
1200 E. California Blvd. MC 1-43 Pasadena, CA 91125
The microPublication project is supported by

The National Institute of Health -- Grant #: 1U01LM012672-01
microPublication Biology:ISSN: 2578-9430